Go 性能分析工具
文章目录
一、PProf 简介
pprof 是用于可视化和分析性能分析数据的工具。
Golang是一个非常注重性能的语言,因此语言的内置库里就自带了性能分析库pprof。
性能分析和采集在计算机性能调试领域使用的术语是profile,或者有时候也会使用profiling代表性能分析这个行为。所以pprof名字里的prof来源于对单词profile的缩写,profile这个单词的原意是画像,那么针对程序性能的画像就是应用使用 CPU 和内存等等这些资源的情况。
使用场景
想要进行性能优化,首先瞩目在 Go 自身提供的工具链来作为分析依据涉及如下:
-
runtime/pprof:采集程序(非 Server)的运行数据进行分析(如果你的应用是工具类应用,执行完任务就结束退出,可以使用
runtime/pprof)1 2 3 4 5 6 7 8 9 10 11 12 13 14import runtime/pprof func main() { // cpu f, err := os.Create(*cpuprofile) ... pprof.StartCPUProfile(f) defer pprof.StopCPUProfile() // memory f, err := os.Create(*memprofile) pprof.WriteHeapProfile(f) f.Close() } -
net/http/pprof:采集 HTTP Server 的运行时数据进行分析
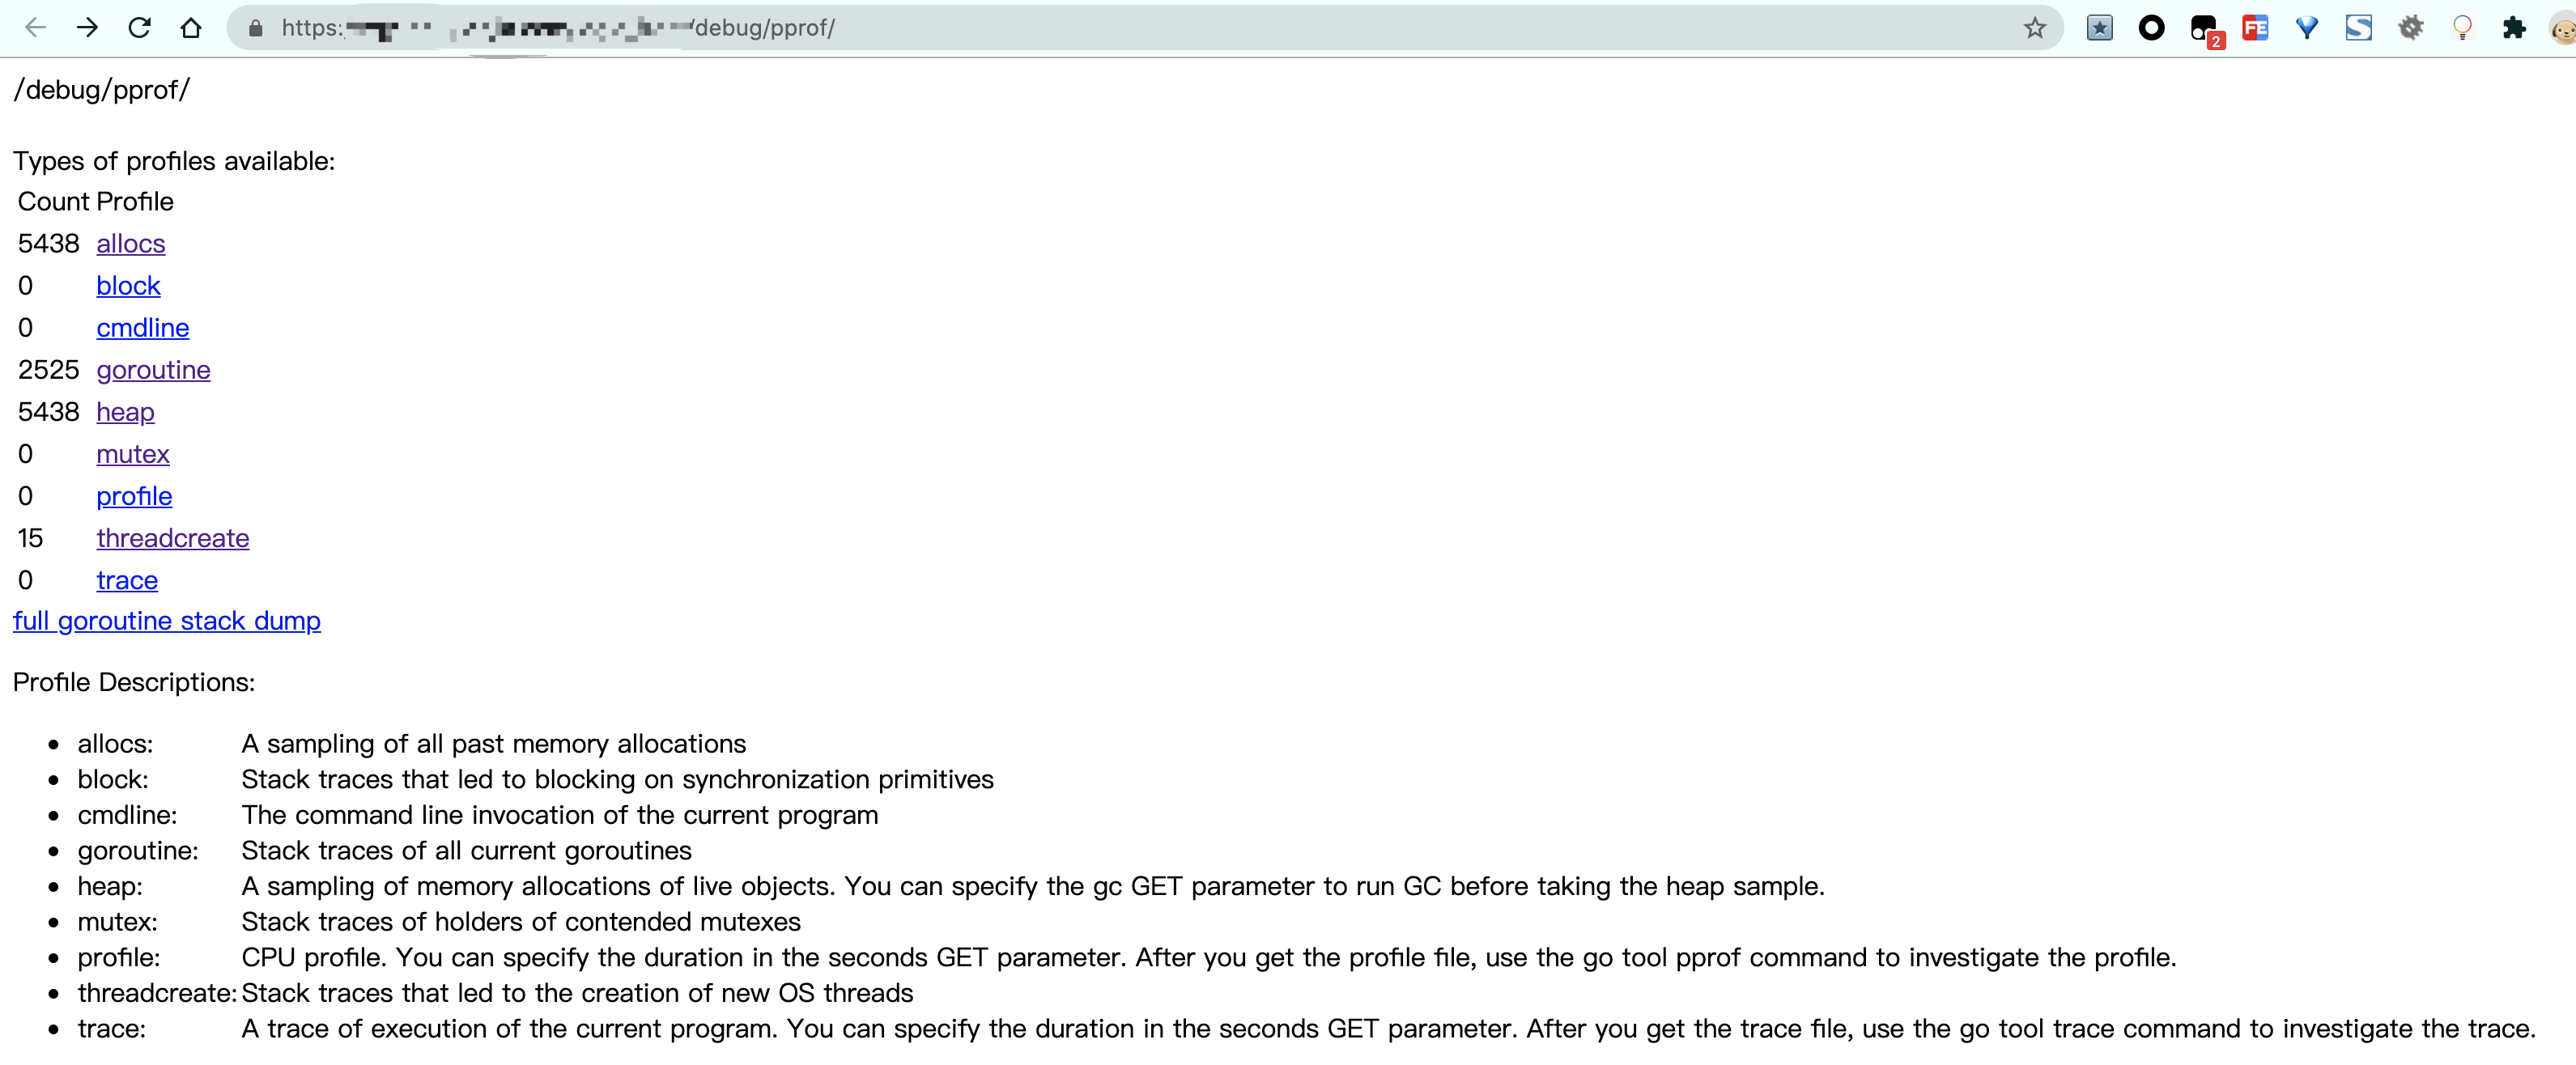
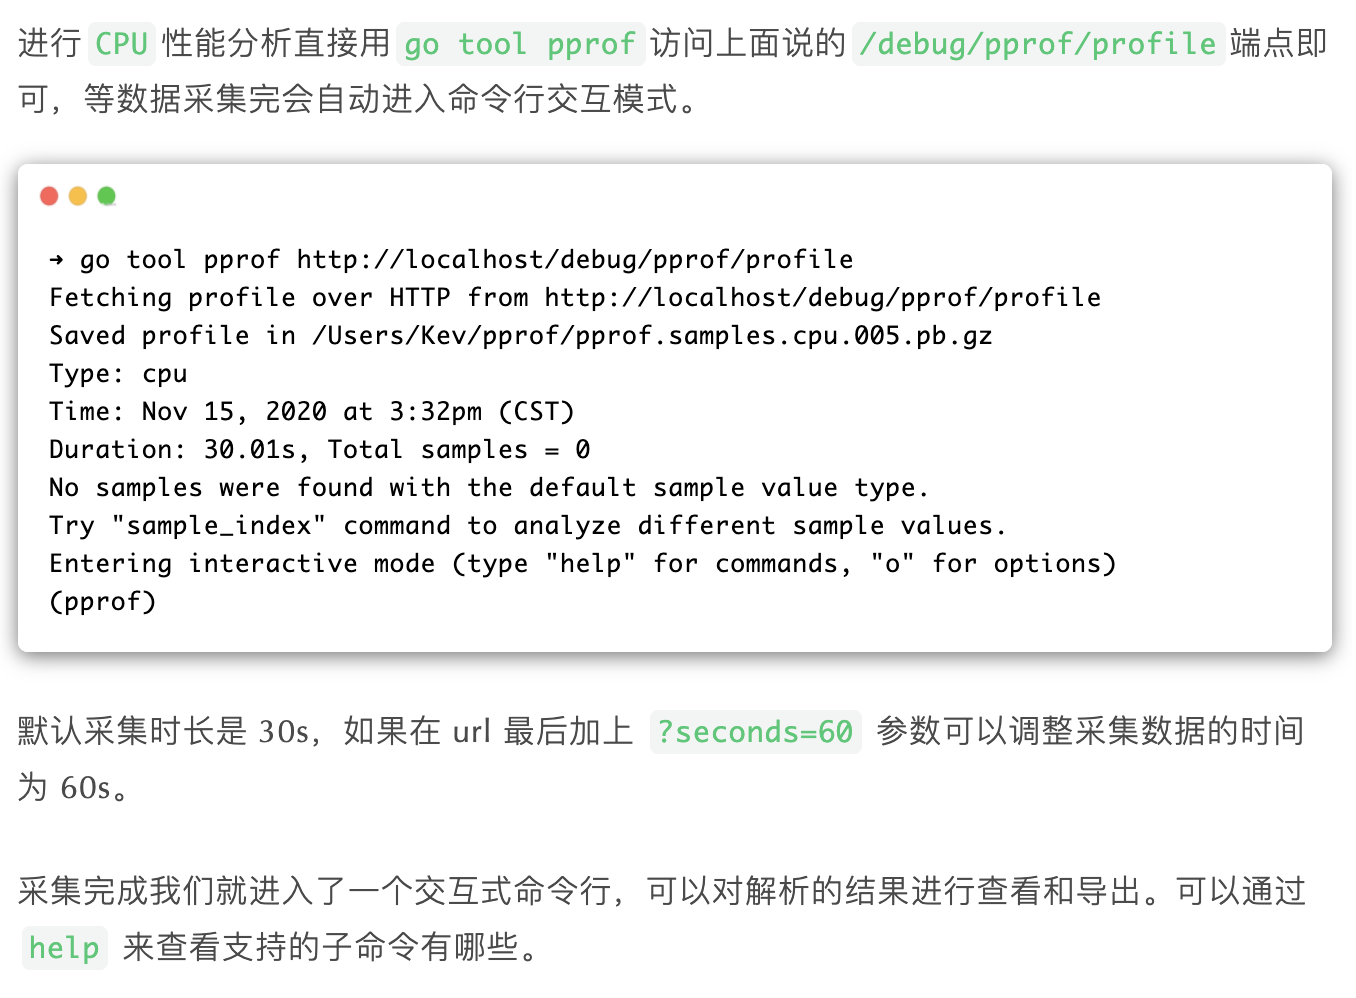
- profile:$HOST/debug/pprof/profile,cpu分析,访问这个链接会自动进行 CPU profiling,持续 30s,并生成一个文件供下载,可以通过带参数?=seconds=60进行60秒的数据采集
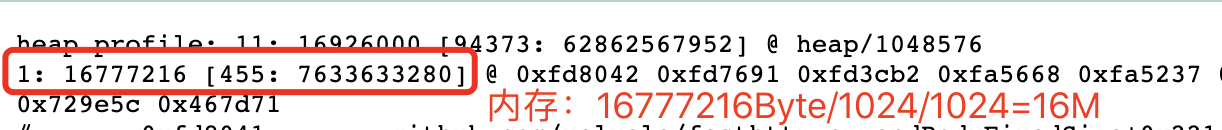
- heap: $HOST/debug/pprof/heap,内存分析,查看活动对象的内存分配情况,如内存泄漏、内存消耗异常等情况
- block:$HOST/debug/pprof/block,阻塞分析,查看导致阻塞同步的堆栈跟踪,如 groutine 的 wait
- goroutine:$HOST/debug/pprof/goroutine,查看当前所有运行的 goroutines 堆栈跟踪
- allocs:$HOST/debug/pprof/allocs,过去活动对象的内存分配情况
- mutex:$HOST/debug/pprof/mutex,互斥锁分析,查看导致互斥锁的竞争持有者的堆栈跟踪
- threadcreate:$HOST/debug/pprof/threadcreate,查看创建新OS线程的堆栈跟踪

使用go tool pprof
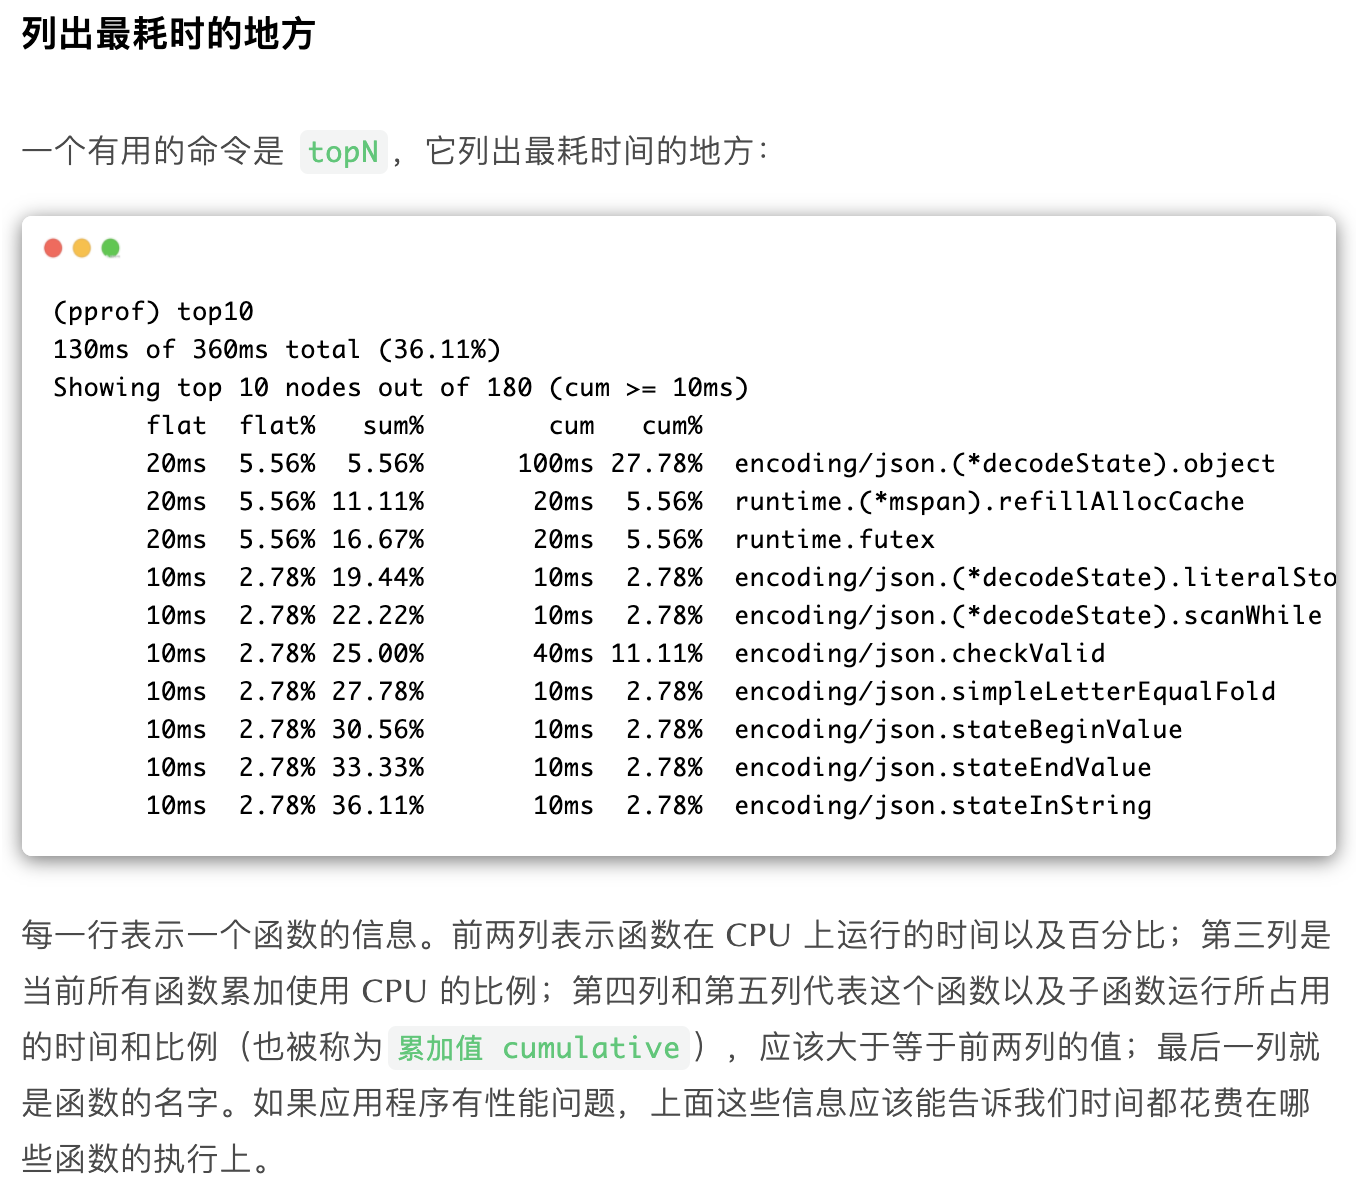
通过上面的设置可以获取服务的性能数据后,接下来就可以使用go tool pprof工具对这些数据进行分析和保存了,一般都是使用pprof通过HTTP访问上面列的那些路由端点直接获取到数据后再进行分析,获取到数据后pprof会自动让终端进入交互模式。
常用命令:go tool pprof 本地文件/网址
-
CPU性能分析
-
内存性能分析
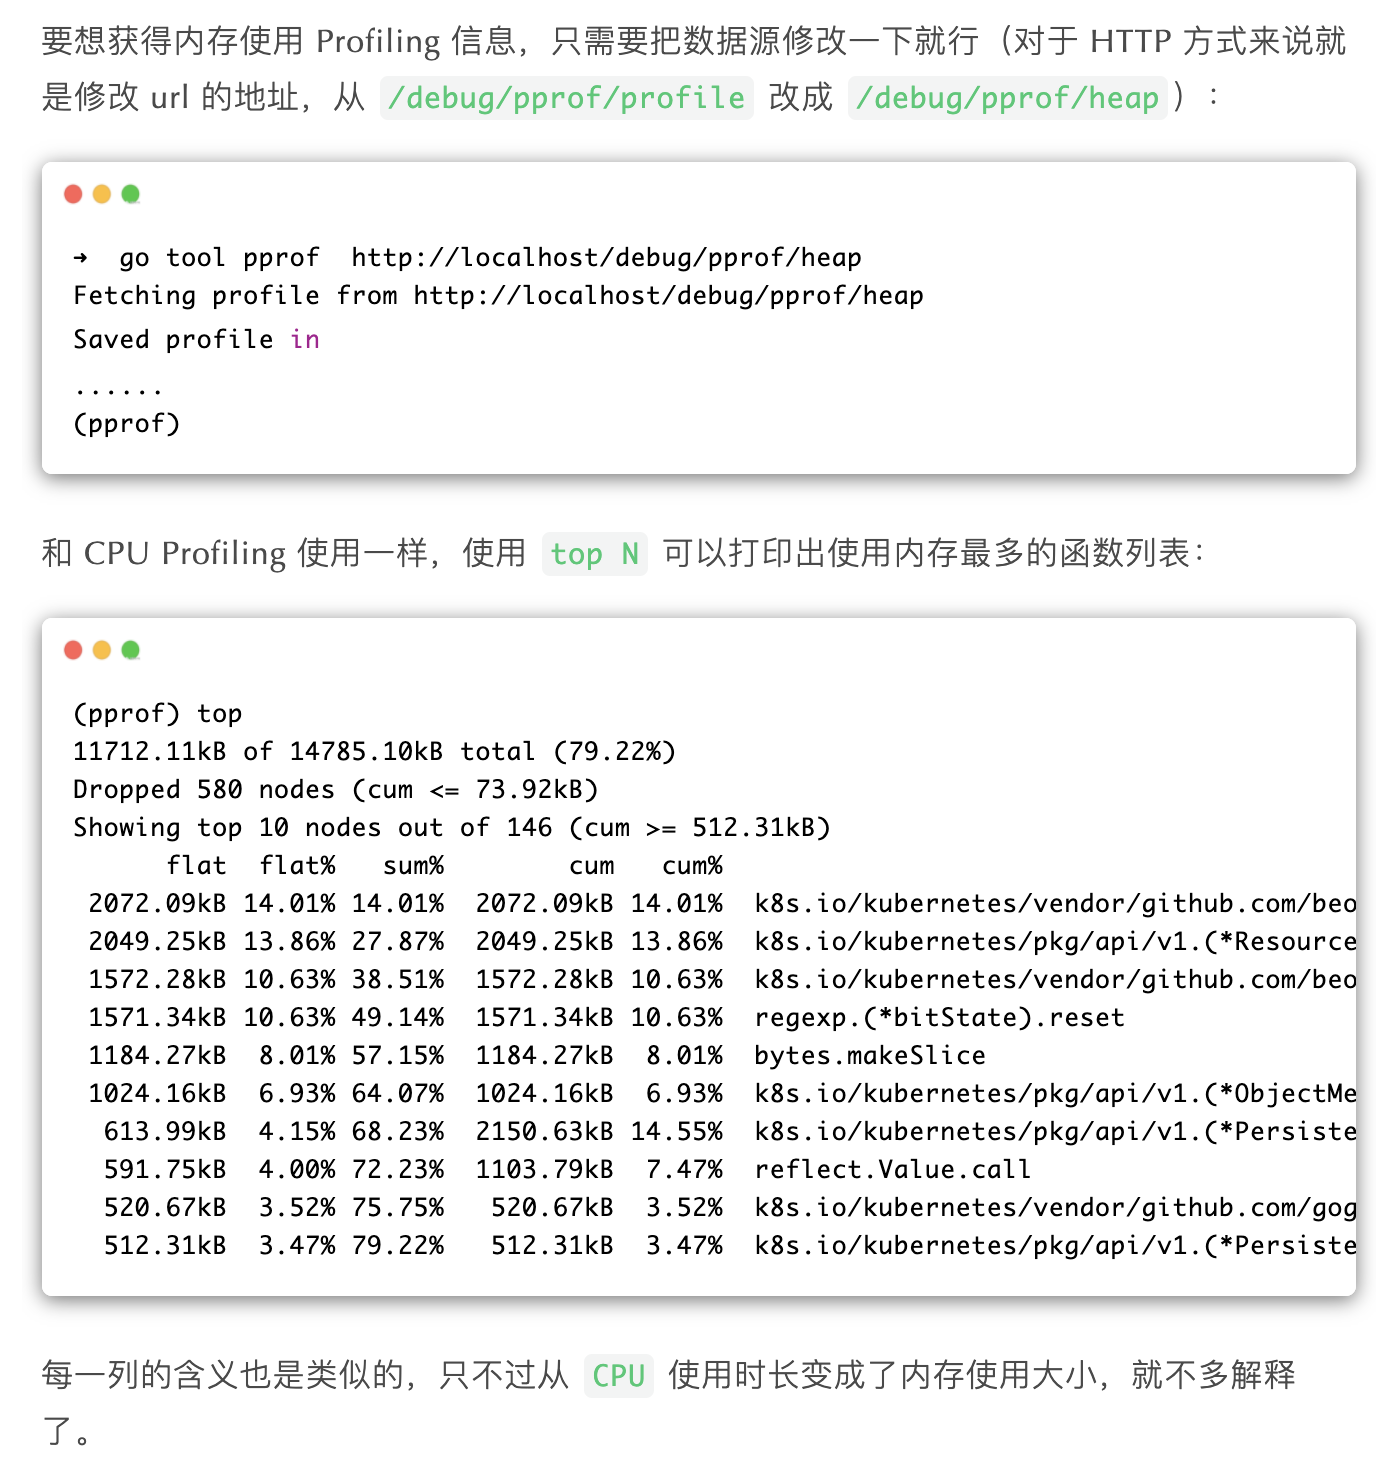
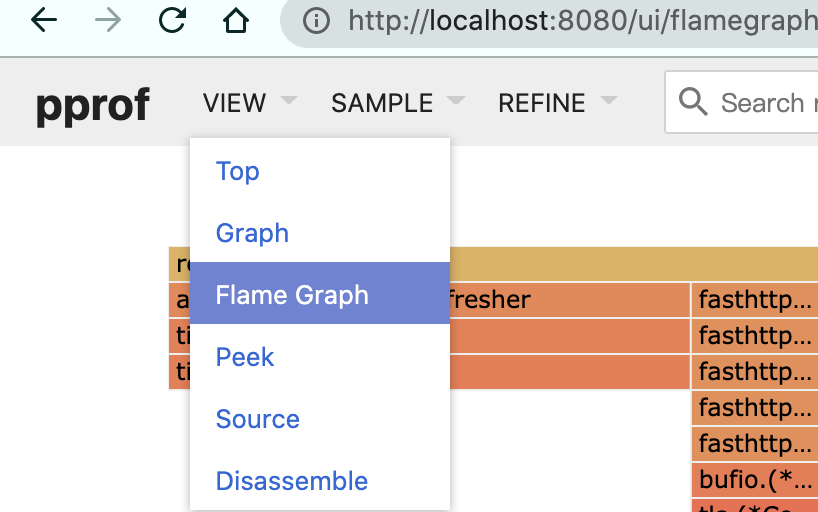
使用web方式分析数据
当然一般线上不可能把 pprof 相关端口/路由开放出来,因为有很大的安全风险。所以,我们一般在线上机器 profile 生成文件,将文件下载到本地分析。
|
|
二、即时效能分析工具 Pyroscope
分析服务器中央处理器 CPU 的利用率『注意:目前 Pyroscope 还不成熟,占用服务器 CPU 过高,无法运用在生产环境–20210416』
|
|